

Mouse IgG2a Isotype Control (Clone: 231)- FITC
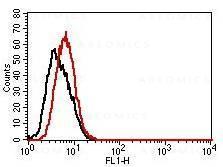
Fig-1: Cell surface flow analysis of FITC-conjugated Mouse IgG2a isotype control in THP-1 cell line using 0.2 µg/10^6 cells (Clone: 231). Black represents cell only; red represents mouse IgG2a isotype control conjugated with FITC.
